Figure L1: Aircraft in level flight. Lift from wings.
by Brooke P. Anderson ("Brooke" in Aces High)
The purpose of this paper is to describe the math behind turn rate and turn radius, and how it relates to lift, thrust, and deployment of flaps.
If you spot errors in my analysis, I would welcome you to contact me at brooke@electraforge.com.
In the following, I will use text to write equations. I will use "*" to denote multiplication, "/" to denote division, and "^" to denote "to the power of", which is all generally familiar. I will use "_" to denote subscripts, as in "C_L_max", which is one variable or quantity, and where "C_L_max^2" would be the square of it.
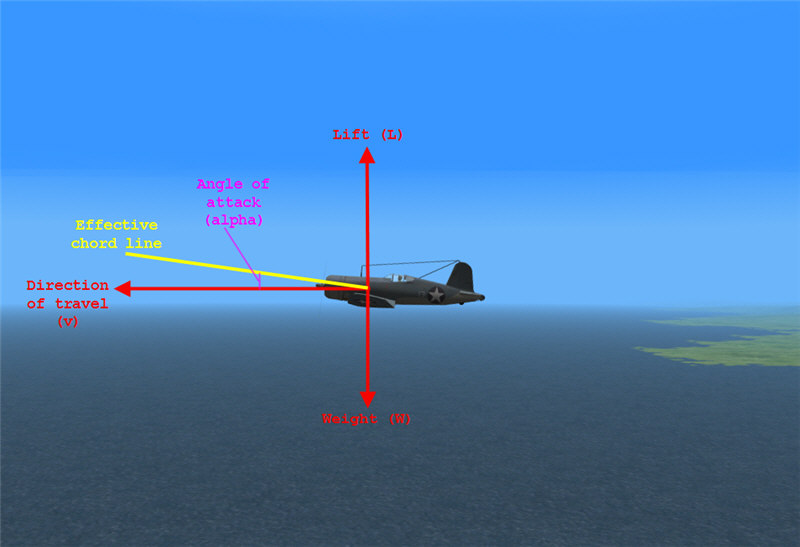
Figure L1: Aircraft in level flight. Lift from wings.
In level flight, the direction of travel of an aircraft (its velocity vector) is parallel to the surface of the earth. Define the direction of lift perpedicular to that. Wings generate increasing lift (up to stall) with increasing angles of attack. The angle of attack is the angle between the direction of travel and the chord line of the wings. A useful equation for lift from the wings is:
Equation 1.1: L = 0.5 * rho * v^2 * S * C_L,
where L is lift perpendicular to the direction of travel, rho is density of the air, v is the true airspeed of the aircraft along its direction of travel, S is the projected area of the wings (mean chord length times wingspan -- i.e., including area overlaid by nacelles and fuselage), and C_L is the coefficient of lift (which is approximately, although not altogether, independent of rho, v, and S). C_L increases with increasing angle of attack up to stall, and then it decreases. Thus, C_L_max happens at stall. Figure CL shows how C_L approximately behaves vs. alpha.
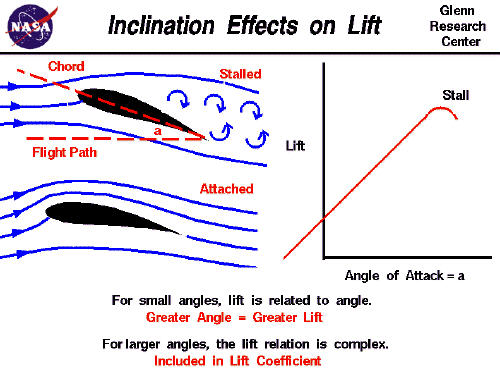
Figure CL: C_L vs. alpha (from http://www.grc.nasa.gov/WWW/K-12/airplane/incline.html).
Likewise, there is an equation for drag using coefficient of drag:
Equation 1.2: D = 0.5 * rho * v^2 * S * C_D.
From aerodynamic theory [PH], there is a relationship between C_L and C_D (when not at stall):
Equation 1.3: C_D = C_D_min + C_L^2 / (pi * e * A),
where pi is the usual pi (3.14...), e is Oswald's efficiency factor, A is the wing's aspect ratio, and C_D_min is the C_D at zero lift (i.e., the minimum C_D or the C_D due to parasitic drag).
From propeller theory, and using 1 HP = 375 mi-lb/hr, we can get
Equation 2.1: T = eta * 375 * gamma * BHP / v,
where T is thrust in pounds, eta is propeller efficiency, gamma is a factor for how much of full power is being applied (1.0 for full power, 0.5 for half power, 0 for no power, etc.), BHP is the brake horsepower of the engine, and v is the aircraft velocity in miles/hour. eta depends on aircraft speed and properties of the particular propeller. It can be looked up for particular aircraft, or it can be estimated in a variety of ways (some better than others, of course).
However, for props with good ability to absorb the power of the engine, it can be approximated reasonably well by knowing the advance ratio (J) and the power coefficient (C_P):
J = 88.0 * v / (N * D),
where v is aircraft speed in mph, N is prop rotation in RPM, and D is prop diameter in feet; and
C_P = 52.5 * gamma* BHP / [(N / 1000)^3 * D^5 * rho / rho_0],
where gamma is fraction of full power being applied, BHP is engine brake horsepower, N is prop RPM, D is prop diameter in ft, rho is the air density, and rho_0 is the air density at standard sea level.
From propeller theory (see [PH] p. 139),
Equation 2.2: eta_i / (1 - eta_i)^(1/3) = (pi / 2)^(1/3) * J / C_P^(1/3),
and eta is approx 0.85 to 0.87 eta_i. This gives the following chart (Figure 3-17 from [PH] p. 144), for eta vs. J/C_P^(1/3), where eta_p is what I am using as eta in the above equations.
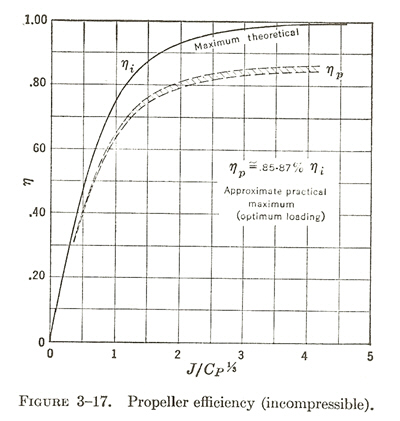
In most cases, near stall and at full power, eta is going to be about 0.6-0.65. As an example (similar to the F4U, F6F, and P-47), for an airplane with a 13 ft diameter prop, running at 2400 RPM at the engine, with a prop reduction gear of 2:1 (so prop at 1200 RPM), having its full 2000 HP (gamma = 1.0), and running at 100 mph (approximate stall speed of most WWII fighters), at sea level, we get J = 88 * 100 / (1200 * 13) = 0.56; C_P = 52.5 * 2000 / (1.2^3 * 13^5) = 0.16; and J/C_P^(1/3) = 1.03 from Figure 3-17. Under these conditions, eta is approx. 0.65. As another example (similar to the P-39, P-40, and P-51), for an airplane with a 11 ft diameter prop, running at 2400 RPM at the engine, with a reduction gear of 2:1 (so prop at 1200 RPM), having a full 1200 HP (gamma = 1.0), and running at 100 mph at sea level, we get J = 0.67; C_P = 0.23; J/C_P^(1/3) = 1.09; and eta is approx. 0.65 from Figure 3-17.
The following figures show an aircraft in a steady-state turn. A steady-state turn is one in which the aircraft speed and altitude is constant, and it is undergoing a steady, circular turn.
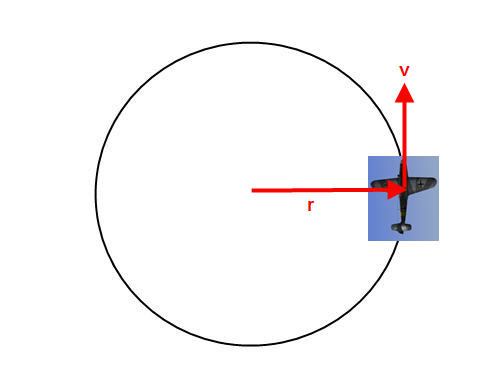
Turn radius is r and aircraft velocity is v in this steady-state turn, as viewed
from above.
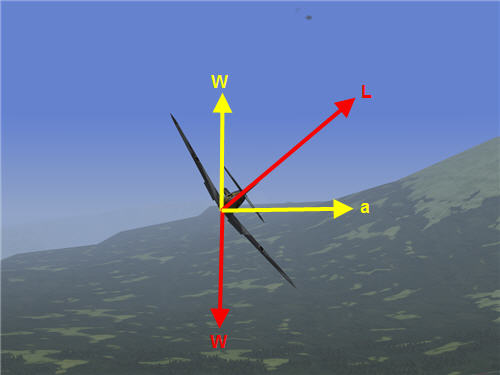
How lift (L) operates in a steady-state turn with respect to weight (W) and
centrifugal acceleration (a).
Let the turn rate (angular rate of change) in the turn be omega. From basic physics or math, we get:
Equations 3.0: v = r * omega and a = r * omega^2.
From these, we can get that a = (v / omega) * omega^2 = v * omega, and thus omega^2 = a^2 / v^2.
In steady state, the vertical component of lift is equal to weight of the aircraft, and the horizontal component is m * a, where m is the mass of the aircraft. Thus,
L^2 = (m * a)^2 + W^2,
This gives a^2 = (1 / m^2) * (L^2 - W^2). Using this, we get omega^2 = a^2 / v^2 = (L^2 - W^2) / (m^2 * v^2). Since W = m * g, we can write this as:
Equation 3.1: omega = (g / v) * sqrt[(L/W)^2 - 1].
This gives omega as function of unknowns v and L, but we can figure out everything as a function of one variable as we are in a steady-state turn, where lots of things balance out. It will end up being easiest to pick the independent variable as eta_i (which is odd -- but you'll see why that is easiest), but it doesn't matter if one considers eta, v, C_L, or C_D as the independent variable and all others to be dependent variables. In the end, they are all tied together, and we'll develop a table of values from which we can pick to plot one thing against the other thing however we would like.
From Equation 2.2, we can find v as a function of eta. eta_i / (1 - eta_i)^(1/3) = (pi / 2)^(1/3) * J / C_P^(1/3), where J = 88.0 * v / (N * D) and eta = 0.85 * eta_i. Thus,
Step 1: J/C_P^(1/3) = eta_i / (1 - eta_i)^(1/3) / (pi / 2)^(1/3).
In the thrust equations, v is specifically in units of miles/hr. In other equations, v is in any units (as long as, say, rho and S are in corresponding units). So, to make the distinction, I will write v specifically as "mph". Using the definition of J, we now can find v:
Step 2: mph = [J/C_P^(1/3)] * C_P^(1/3) * N * D / 88.
In other equations, it will be handiest to have v in ft/sec (to work more easily, say, with S in units of ft^2).
Step 3: fps = 1.467 * mph
Now if we can get L as a function of v, we are all set. From Equation 1.1, we already know that L = 0.5 * rho * v^2 * S * C_L, so all we need is C_L as a function of v. We can get C_L as a function of C_D, and we can get C_D as a function of v as follows.
In steady state, the thrust is equal to the drag, so, using Equation 1.2, T = D = 0.5 * rho * v^2 * S * C_D, and we have C_D = T / (0.5 * rho * v^2 * S). Using Equation 2.1 (again writing "mph" for velocity, since Equation 2.1 is also specifically written for velocity in those units) with gamma = 1 (full power), we get:
Step 4: T = eta * 375 * BHP / mph, where eta = 0.85 * eta_i.
Then,
Step 5: C_D = T / (0.5 * rho * v^2 * S),
(Note: for the units to work easily, for sea level, we can write rho = (mass / volume) = (mass * g / volume) / g = (weight / volume) / g = 0.0748 lbs/ft^3 / g, where g = 32 ft/s^2, S is in units of ft^2, and v is in ft/sec.)
From Equation 1.3, we can get C_L as a function of C_D and thus of v:
Step 6: C_L = sqrt[(pi * e * A) * (C_D - C_D_min)].
Also,
Step 7: L = 0.5 * rho * v^2 * S * C_L,
where again rho = 0.0748 lbs/ft^3 / g, g = 32 ft/s^2, v is in ft/s, and S is in ft^2. Finally, we can plug L into Equation 3.1 to get omega.
Step 8: omega = (g / v) * sqrt[(L/W)^2 - 1].
If you want omega in degrees/sec, you need to multiply by 360/(2 * pi):
Step 9: dps = 360 / (2 * pi) * omega.
We are all set. We can generate a list of eta_i. For each eta_i, we can calculate J/C_P^(1/3), then mph, then v (in fps), then T, then C_D, then C_L, then L, then omega (from Equation 3.1), then dps. Then we'd have a table of omega vs. C_L or omega vs. eta or omega vs. v or whatever vs. whatever.
Let's make a spreadsheet, plug in some values, and see what we get. For a P-51D (in approximate numbers from [FD]), N = 1500 RPM, D = 11 ft, S = 236 ft^2, A = 5.8, W = 9600 lbs, BHP = 1700 HP. For WWII fighter planes (see reference section), C_D_min for clean configuration is about 0.02 (based on [BM] p. 177 and [JA] p. 269 and [LL]), e is about 0.8 (0.7 to 0.85 for most airplanes, [PH] p. 95).
Here is a link to the spreadsheet in case you want to mess with it.
Plotting various things (deg/sec, T, mph, eta, C_L/C_D vs. C_L, all scaled to fit well on the same graph), we get the following. (C_L/C_D = L/D, by the way.)
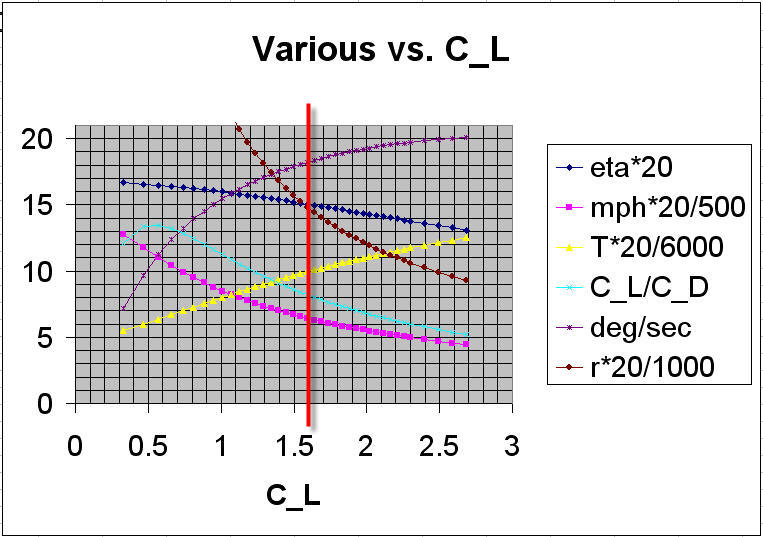
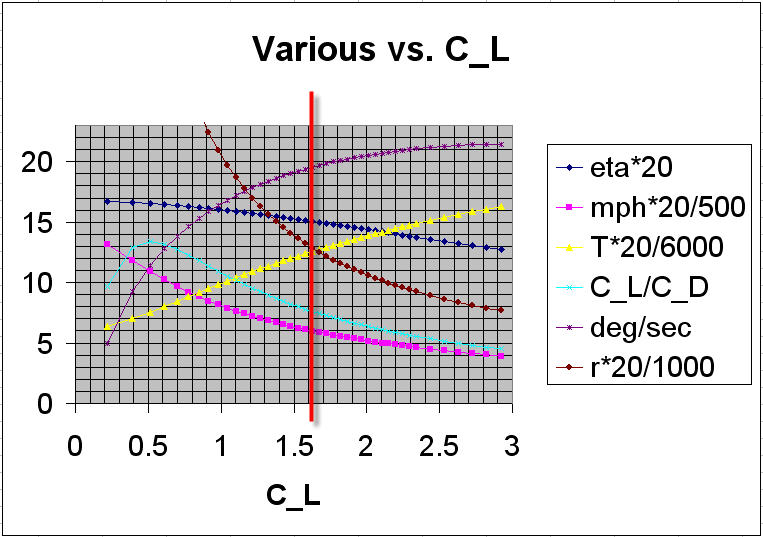
Scaled versions of eta, v, T, L/D, deg/sec, and r vs. C_L. No flaps.
Most WWII fighter wings would stall at about C_L = C_L_max = 1.6 ([JA] Appendix D), as indicated on the graph. The graph shows the relations of various values (vs C_L) in a steady-state turn. We can see that deg/sec increases with C_L, L/D has a peak at lower C_L, v decreases with C_L, T increases with C_L (mainly because T for prop planes increases as v decreases), and so on.
The main conclusion is that turn rate (deg/sec) increases with C_L, so best turn rate is obtained by going up to C_L_max, i.e., by flying near stall -- the classic "stallfight" turn.
For the P-51D model we have used, max turn rate is about 18 deg/sec at a velocity of 6.5 * 500 / 20 = 162 mph. This is reasonably close to what we get in Aces High, and that is with estimates for e, C_D_min, and C_L_max for the P-51D -- decent estimates, but estimates nontheless.
With flaps, C_D_min is about 0.02 plus the contribution for flaps (which is about 0.06 for 60 degrees down, see [PH] p. 96) = 0.08. I'm not sure how e changes with flaps down -- I'll keep it a 0.8. From [JA] Appendix D, many WWII-like wing designs with full flaps stall around C_L_max of 2.1 to 2.8 or so. I'll assume C_L_max with full flaps is then 2.5. However, that is for a wing with full-span flaps. The P-51D has flaps that span about 50% of the full wingspan but with flaps at the portion of the wing with longer chord. Since L = 0.5 * rho * v^2 * S * C_L = (lift of wing portion with flaps) + (lift of wing portion without flaps), I will approximate S * C_L = S_wflaps * C_L_wflaps + S_woflaps * C_L_woflaps = 0.5 * S * C_L_wflaps + 0.5 * S * C_L_woflaps. So C_L_max = 0.5 * 2.5 + 0.5 * 1.1 (as the section with no flaps will not be at its C_L_max when the flaps region is at its C_L_max -- see [JA] Appendix D). I am thus estimating a C_L_max = 1.80. With this, we get the following graph.
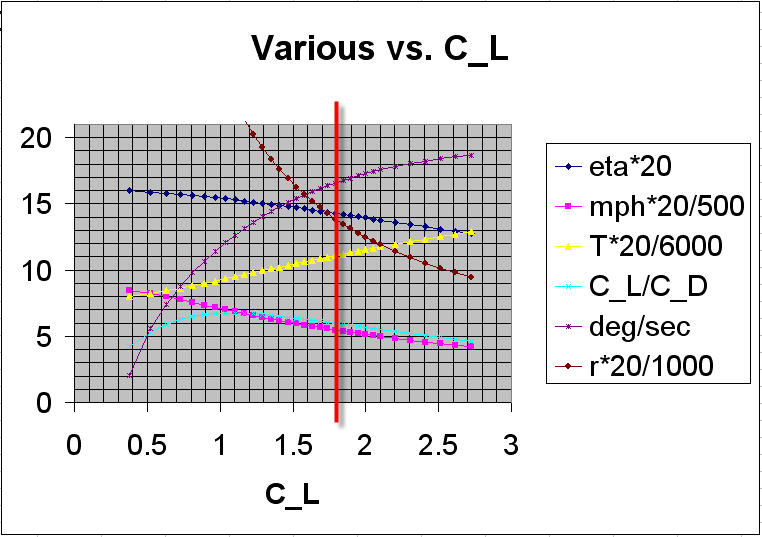
Scaled versions of eta, v, T, L/D, deg/sec, and r vs. C_L. Full flaps.
Note that turn rate is lower, but max turn rate still happens at C_L_max -- i.e., the "stallfight" turn still results in max steady-state turn rate. All of the parameters behave similarly with C_L -- the difference is that the C_L_max one can pull with flaps down is higher, the turn rate is lower, the L/D is lower with a peak at higher C_L, etc. The max turn rate is about 16.5 deg/sec at a speed of 5.5 * 500 / 20 = 138 mph.
We could get more-accurate estimates by calculating C_L_max for the P-51D from
its published stall speeds, as discussed in Appendix: Relation to Stall Speed.
Also, as we see in Appendix: F4U-1, it might be a general trend that e is higher
with flaps than without.
We have looked at turn rate and found that "stallfight" turns maximize turn rate according to the above model (which is an approximation, like all models, but probably one giving correct trends). What about turn radius? From v = r * omega, we get:
r = v / omega.
As seen from the above graphs, we get the smallest turn radius at C_L_max and thus also in a "stallfight" turn, and radius is decreased by use of full flaps -- which is exactly what we'd expect. For our model, the turn radius without flaps is about 14.75 * 1000 / 20 = 740 ft, and with full flaps it is 13.75 * 1000 / 20 = 690 ft. These are similar to, but a little larger than, the turn-radius values for the P-51D in Aces High -- but again, I am using rough estimates for C_L_max, C_D_min, and e. See Appendix: F4U-1 for a study with more precise values there.
This document shows that turn rate in steady-state turns is maximized in "stallfight" turns (turns keeping near C_L_max, i.e., near stall). It shows that for typical WWII fighter-style aircraft, dropping full flaps tends to decrease maximum turn rate a little. It shows the obvious -- that turn radius is minimized by "stallfight" turns and further by deploying flaps. These conclusions are for a P-51D-type aircraft with reasonable assumptions where exact values are not known. It is possible that there are fighters that have less-efficient flaps than the ones modelled here, in which case they will have a larger turn-rate decrease with flaps deployed; and it is possible that there are fighters that have more-efficient flaps, in which case they will have a smaller turn-rate decrease. But this document should give decent general trends for WWII fighters.
1 knot = 1.1508 mph
88 fpm = 1 mph
1.467 ft/s = 1 mph
1.609 kph = 1 mph
1 kph = 0.6124 mph
At sea level, rho = 1.2 kg/m^3. In terms of weight per volume, that is 0.0748 lbs of air in one ft^3.
Stall speed is the minimum v at which the aircraft can fly such that it is not losing altitude (i.e., at which lift still equals weight). At stall, from Equation 1.1, L = W = 0.5 * rho * v^2 * S * C_L. Clearly, v is smallest when C_L is largest, so W = 0.5 * rho * v_stall^2 * S * C_L_max. Thus, C_L_max = W / (0.5 * rho * v_stall^2 * S). Thus, lower v_stall contributes to larger C_L_max.
A larger C_L_max, as we've seen, increases turn rate and decreases turn radius.
Also, using stall speed, one can figure out what C_L_max is more precisely, both with and without flaps. One can also find stall speed at a different aircraft weight since W_1 = 0.5 * rho * v_stall_1^2 * S * C_L_max and W_2 = 0.5 * rho * v_stall_2^2 * S * C_L_max; so v_stall_2 = v_stall_1 * sqrt(W_2 / W_1).
What about climb rate? Climb rate (unlike max steady-state rate of turn and minimum turn radius) is well handled in most books about aerodymics and aircraft performance, so you can look this stuff up in most of the references below. From this discussion of aircraft dynamics, we have alpha = (angle of attack), phi = alpha + (angle of incidence of wings), theta = (angle of climb), and v = velocity and specifies direction of travel. Thus,
v_climb = v * sin(theta).
In the coordinate system of the direction of travel (v), where lift is perpendicular to v, we have two main equations: first, an equation balancing lift and weight, (total lift) = ((wing lift) + (lift due to thrust)) = (weight component) and, second, an equation balancing thrust and drag, (thrust component) = (total drag) = ((drag due to lift) + (drag due to component of weight)). In terms of the math, L + T * sin(phi) = W * cos(theta), and T * cos(phi) = D + W * sin(theta).
L can be written as a function of C_L. Since C_D = C_D_min + C_L^2 / (pi * e * A), D is also a function of C_L. Likewise C_L and alpha are functionally related (they are fairly linearly related away from stall), so alpha and phi can be thought of as a function of C_L. So, we have three equations (lift, drag, and the v_climb equation) and four unknowns: v_climb, v, theta, and C_L. We can use the three equations to get down to v_climb as a function of C_L (or v_climb as a function of v), which we can then maximize to find the maximum v_climb and the C_L (or v) at which that happens. This can be done computationally, analytically with as much math as you care to do, or you can simplify a bit because phi and theta are small (which is the route I will take).
In normal steady-state climbs for WWII fighters, phi is very small and is not large enough to make T * sin(phi) significant compared to L, and T * cos(phi) is close enough to T. Also, while theta is not as small as phi, it is small enough that W * cos(theta) is approximately W. Under these approximations, W = L and T = D + W * sin(theta). So, v * sin(theta) = v * (T - D) / W, and
v_climb = v * (T - D) / W,
which is the normal equation you find for climb rate in the various books. Since W = L, we can write D = (D/L) * L = (D/L) * W and get:
v_climb = v * (T/W - D/L) = v * T / W - v / (L/D) = (term 1) - (term 2)
Since J/C_P^(1/3) ~ v, a graph of eta as a function of v has the same shape as the graph in the "Thrust Equations" section. At lower v, eta ~ v. At higher v, eta ~ const (as it flattens out). From equation 2.1, v * T = eta * 375 * gamma * BHP, so v * T ~ v at low v and v * T ~ const at higher v, with a knee in between, which is then the behavior of v * T / W, the first term of v_climb -- i.e., it is monotonically increasing with v, but flattens out.
v * D/L = v * C_D / C_L = v * [C_D_min + C_L^2 / (pi * e * A)] / C_L
L = W = 0.5 * rho * v^2 * S * C_L, so C_L = W / (0.5 * rho * v^2 * S)
v * D/L = 0.5 * rho * v^3 * S / W * [C_D_min + (W / (0.5 * rho * v^2 * S))^2 / (pi * e * A)]
v * D/L = 0.5 * rho * S / W * v^3 * (C_D_min + W^2 / [(pi * e * A) * (0.5 * rho * S)^2 * v^4])
So, (term 2) ~ 1 / v at lower v and (term 2) ~ v^3 at higher v. Term 2 thus decreases and then starts increasing, so there is a minimum, which is around where we get our maximum rate of climb. This minimum is near where D/L is a minimum, or where L/D is a maximum. Note from the charts above that L/D is a maximum well away from C_L_max, and so v_stall (which is related to C_L_max as explained in Appendix "Relation to Stall Speed") does not have an influence upon climb rate. Also, the max L/D is lower with flaps than without, so climbing with flaps will result in a lower max rate of climb than climbing without flaps.
So, v_stall and even lift alone have little to do with climb performance, but L/D and T/W have big influences.
In the equations above, flaps do two things: they increase C_D_min, and they increase C_L_max. Basically, they add drag and allow the wing to get to a higher C_L before stall happens by shifting the C_L vs. alpha curve up. Looked at another way, they add lift and drag, but they reduce L/D because they add more drag than lift. As shown above, use of flaps reduces the steady-state turning radius, decreases climb rate, and either slightly reduces or in some cases increases the steady-state turning rate (depending on the aircraft and how good its flaps are).
Let's try to get more exact in the case of the F4U-1, as in Aces High, it is a surprisingly good turner with full flaps. For the thrust equations, from [FD], it has a 13.3 ft diameter prop, running at 2700 RPM at the engine, with a prop reduction gear of 2:1 (so N = 1350 RPM), having its full 2000 HP (gamma = 1.0), at half fuel, W = 11,300 lbs, S = 314 ft^2, A = 5.35.
We can get a more-exact C_L_max from [F4U], using the published stall speeds. From [F4U], the F4U-1 has a stall speed of 82 knots calibrated airspeed at 11,300 lbs weight with flaps up and power on. (This is using stall-speed information from Section II, Part 16 and calibration information from Section III, Part 2, where linear regression gives, for clean configuration in knots, CAS = 1.1 * IAS - 11; for full flaps in knots, CAS = 1.1 * IAS -10). See Appendix: Relation to Stall Speed. v_stall = 82 knots = 82 * 1.15 mph = 94 mph = 93 * 1.467 ft/sec = 138 ft/sec. Then, C_L_max = 11,300 / (0.5 * 0.0748 / 32 * 138^2 * 314) = 1.62. With full flaps (50 deg), from the same source, power-on stall is at 63 knots calibrated airspeed at 11,300 lbs. v_stall = 63 knots = 63 * 1.15 mph = 72 mph = 72 * 1.467 ft/sec = 106 ft/sec. Then, C_L_max = 11,300 / (0.5 * 0.0748 / 32 * 106^2 * 314) = 2.74. (Wow! -- that is great C_L_max!).
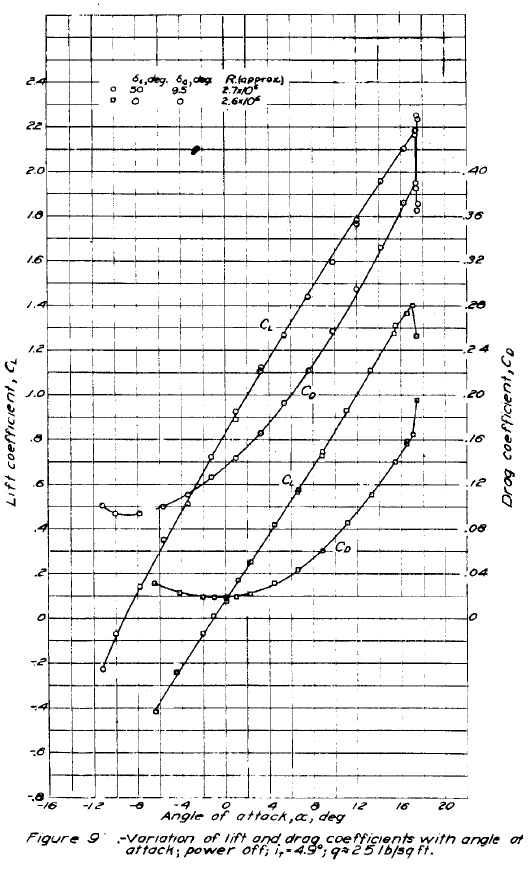
Our normal assumptions above, in absence of better data, is to assume e = 0.80 and C_D_min = 0.02 with flaps up and, for full flaps, e = 0.70 and C_D_min = 0.08. However, [GA] allows us to get better estimates by looking at data in clean condition and for full flaps when the special split flaps aren't used (as the special split flaps and aileron drop are special features being tested on the model but weren't on the actual F4U-1). Looking at Figure 9 from [GA], we can get that C_D_min = 0.019 in clean condition and C_D_min = 0.093 with 50 degrees flaps (and a bit of drooped ailerons -- but there is no data in the report without drooped ailerons). (So, our earlier estimates of C_D_min = 0.02 clean and 0.08 with full flaps weren't too bad.) From the data in Figure 9, we can get C_D vs. C_L and get a table of calculated e = C_L^2 / (pi * A * (C_D - C_D_min)). Then we get e = median{set of all the calculated e's} = 0.81 for clean (no flaps) condition and e = 0.95 with full flaps. It is interesting that e goes up appreciably for full flaps for the F4U-1.
(Note that Figure 10 in [GA] gives C_L_max with power on to be about 1.6 clean and 2.55 with full flaps. I'll use the values from [F4U], though, as those are for the real, flying, full-scale F4U-1.)
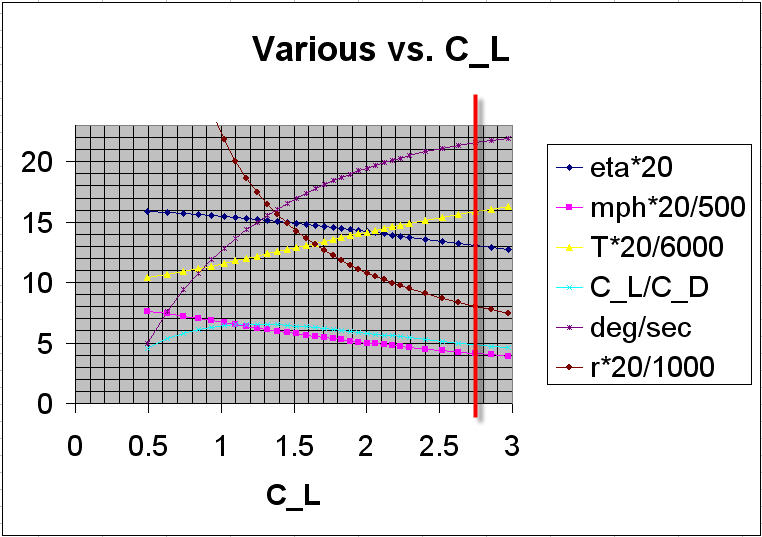
Scaled versions of eta, v, T, L/D, deg/sec, and r vs. C_L. Flaps up.
Scaled versions of eta, v, T, L/D, deg/sec, and r vs. C_L. Full flaps.
So, with flaps up, the F4U-1 has a max steady-state turn rate of 19.5 deg/sec and a minimum turn radius of 13 * 1000 / 20 = 650 ft at a speed of 6 * 500 / 20 = 150 mph. With flaps down, it has a max turn rate of 21.5 deg/sec and a minimum turn radius of 8 * 1000 / 20 = 400 ft at a speed of 4.25 * 500 / 20 = 106 mph. Yes, the F4U does seem to have higher turn rate with full flaps. The Aces High values (from DoK's comparison web site with data from MOSQ) are 674 ft and 425 ft -- quite close to these calculated values.
Let's see what the model has to say about the P-38J. We'll plug values into the spreadsheet.
From [FD], the P-38J has D (prop diameter) = 11.5 ft, S (wing area) = 327.5 ft^2, A (aspect ratio) = 8.24, Number of engines = 2, BHP (horsepower) = 1600 HP, N (prop RPM) = 1429 RPM, W (weight at half fuel load in Aces High and full ammo) = 16,462 lbs. From [P38] at weight of 15,000 lbs (doing linear regression on the CAS vs. IAS table, where for clean CAS = 0.851 * IAS + 29.52, and for full flaps CAS = 0.783 * IAS + 29.91), v_stall, clean = 110 mph CAS; v_stall, full flaps = 84 mph CAS. I will assume e = .8 clean, 0.95 full flaps. From [LL] Appendix A, Table III, C_D_min with flaps up was 0.0268 for P-38L (and so should be about the same for a P-38J). I will assume C_D_min with full flaps is 0.0968.
So, I am operating with three assumptions: e clean = 0.8, e full flaps = 0.95, and C_D_min full flaps = 0.0968. Also, in the above, I'm using power-off stall speeds, as the P-38 pilot's manual doesn't seem to have the power-on numbers (unlike the F4U manual). If I used power-on values, the estimated C_L_max would be higher, and the estimated turning performance would come out a little better.
With these values, with flaps up (clean), we get C_L_max = 1.50, and the following graph.
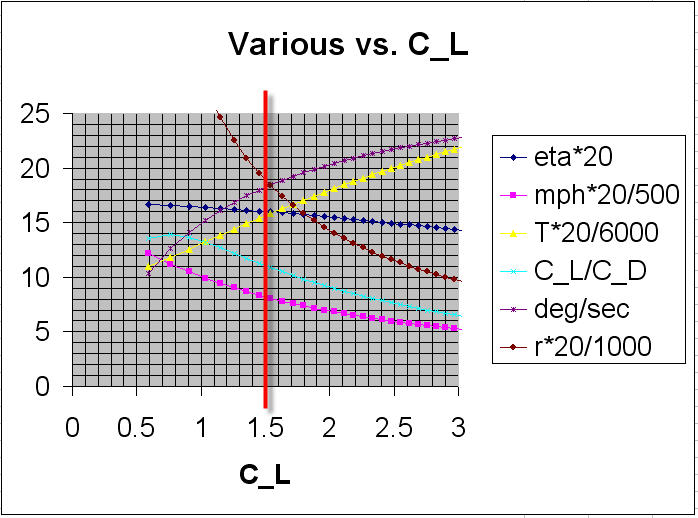
Scaled versions of eta, v, T, L/D, deg/sec, and r vs. C_L. Flaps up.
With these values, with full flaps, we get C_L_max = 2.58, and the following graph.
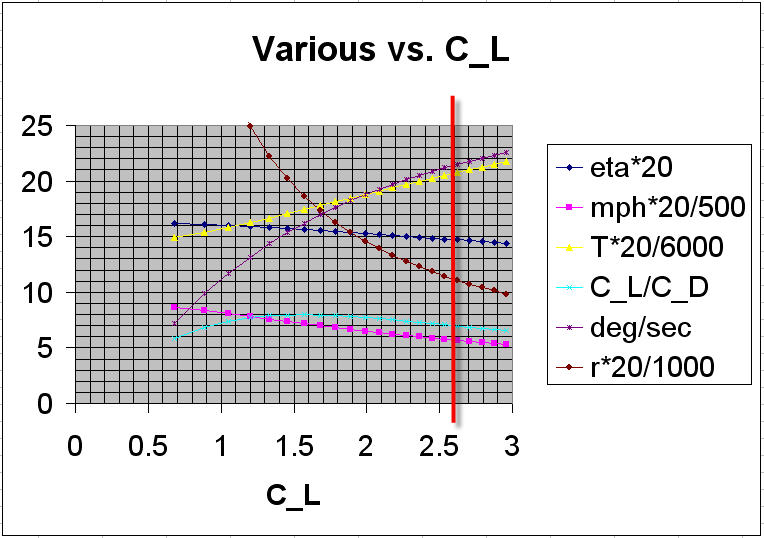
Scaled versions of eta, v, T, L/D, deg/sec, and r vs. C_L. Flaps full down.
For the P-38J flaps up, this model predicts for steady-state turns at sea level, max turn rate = 18.2 deg/sec, min turn radius = 19.0 * 1000 / 20 = 950 ft, v = 8.2 * 500 / 20 = 205 mph. Thus, with flaps up, the P-38J is predicted to have a little worse turn rate than the F4U-1, but a much larger turn radius and larger speed in the turn. For the P-38J with flaps full down, the model predicts, max turn rate = 21.3 deg/sec, min turn radius = 11.2 * 1000 / 20 = 560 ft, v = 5.7 * 500 / 20 = 143 mph. With flaps down, the P-38J is thus predicted to have about the same turn rate as the F4U-1, but a larger turn radius and larger turning speed.
The turn radii in Aces High (from MOSQ's data) are 817 ft clean and 598 ft with full flaps. The turn rates from my experimentation off-line are 17.4 deg/sec at 182 mph clean, and 18.3 deg/sec at 150 mph with full flaps. So, the numbers in Aces High are a little different, but they are not hugely different from the model. The model basically predicts 10% higher turning rate than in Aces High, and 10% higher velocity in turns. This could be due to the model in Aces High having better numbers or being more accurate than this model.
[PH] Airplane Performance Stability and Control, by Courtland D. Perkins and
Robert E. Hage.
[VM] Theory of Flight, by Richard Von Mises.
[RS] Fundamentals of Flight, Second Edition, by Richard S. Shevell.
[BM] Aerodynamics Aeronautics and Flight Mechanics, Second Edition, by Barnes
W. McCormick.
[FD] America's Hundred Thousand, by Francis H. Dean.
[JA] Introduction to Flight, by John D. Anderson, Jr.
[LL] Quest
for Performance: The Evolution of Modern Aircraft, by Laurence K. Loftin,
Jr, (a NASA report).
[P51] Flight Handbook, USAF Series F-51D Aircraft.
[F4U] Pilot's Manual, The Chance Vought F4U Corsair, US Models F4U-1, FG-1,
F3A-1, British Corsair I, II, III.
[GA] Tests
in the 19-foot Pressure Tunnel of a 1/2.75-Scale Model of the F4U-1 Airplane
With Several Balanced Elevators, Full-Span Flaps, and Droppable Gas Tank, by
Robert R. Graham and C. Dixon Ashworth, (a NACA Wartime Report, available from
NACA document search).
[CGK] Calculated
and Measured Turning Performance of a Navy F2A-3 Airplane as Affected by the
Use of Flaps, by Lawrence A. Clousing, Burnett L. Gadeburg, and William
M. Kauffman, (a NACA Wartime Report, available from the NACA document search).
[WC] The
P-38 Lightning: Evolution of Speed and Climb Performance, by Wayne Cunningham.
This section lists changes, version to version.
v1.0, 7/22/2007
-- Initial version of the document.
v1.1, 7/28/2007
-- Added the Appendix: P-38J to see how the P-38 comes out according to the
model.
v1.2, 7/30/2007
-- Added the linear-regression parameters for CAS vs. IAS for F4U and P-38.
by Brooke P. Anderson
e-mail: Brooke@electraforge.com
Click here to go back to my main gaming page.